



In one important sense, polls got the story of this year’s election right: They showed Democrats winning the House and leading in the race for control of the Senate.
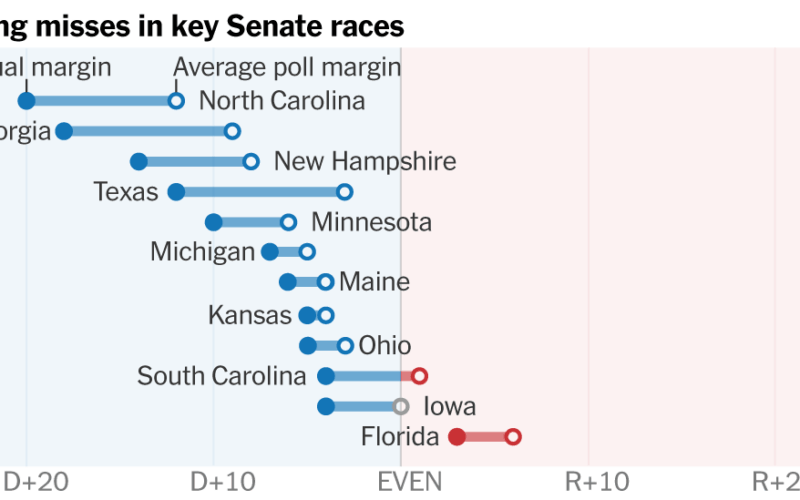
By another measure, this year’s polls were among the worst in recent memory. When looking across all pollsters, surveys systematically underestimated the support of Democratic candidates, and they did so on a scale that rivaled or even exceeded the heavily criticized misses of 2016 and 2020, when polls underestimated Republicans.
Overall, national polls this year underestimated the strength of Democrats by around four percentage points. Across the key Senate races, the polls underestimated Democrats by an even larger five-point miss, compared with an average of about 3.5 points across all Senate races.
This error is similar in size to the recent Trump-era polling presidential polling misfires. In 2020, national polls underestimated Republicans by about four percentage points; in 2016, Republicans were underestimated by three points.
Not every pollster this year erred by so much. The New York Times/Siena Poll, for instance, did not systematically underestimate the Democrats. Neither did a handful of other pollsters, including AtlasIntel and Survey 160.
Overall, the final Times/Siena polls underestimated Democrats by less than one percentage point, with some polls underestimating Democrats and others underestimating Republicans.
But across all pollsters, most polls underestimated Democrats, and in some states the error was huge. In Texas, the polls underestimated James Talarico’s margin of victory by nine percentage points. In general, the misses were less extreme in the classic northern battleground states, while pollsters struggled in the Sun Belt, where Democrats made their largest gains.
There are a number of theories as to why the error was so large. One particularly strong possibility is the role of turnout, which appears to have been far stronger for Democrats than many pollsters assumed.
The fact that the polling error has exceeded — or at least been on par with — the worst polling errors in recent history, however, suggests there may be something bigger and systematic at play.
Pollsters have adopted new sampling and weighting techniques to compensate for the voters they are failing to reach. More and more, pollsters are weighting their surveys to the respondents’ recalled vote history. But that approach assumes the composition of the electorate will look mostly the same from one cycle to the next, which this year led to polls being tilted toward Republicans.
When much of the industry responds to these challenges in the same ways, pollsters end up making similar mistakes. The kind of widespread polling error we’ve seen recently may become more common.
Turnout and weighting decisions played a role.
While the data isn’t final in much of the country, there are lots of signs that turnout was more favorable to the Democrats than most polls had anticipated.
Take Florida, for example. Unlike most other states, we already know the makeup of the Florida electorate: Registered Republicans outnumbered Democrats by about 8.5 percentage points, according to turnout information available from election officials. That’s not what most polls showed. Our final Times/Siena poll of the race, which overestimated Senator Ashley Moody’s support by three percentage points, had a likely electorate with Republicans ahead by 13 points in terms of party registration.
A similar story might have unfolded elsewhere in the South, where the Black and Hispanic share of the electorate was higher than it had been in previous cycles.
Why did the polls underestimate the Democratic turnout? The answer varies from pollster to pollster.
One factor might be that pollsters are relying on increasingly heavy-handed methods of weighting, where a pollster gives more weight to voters from groups who were underrepresented among survey respondents. Since 2016, and especially since 2020, pollsters have been trying to properly represent Mr. Trump’s supporters, in part by ensuring that they have the right number of people who reported voting for Mr. Trump in the previous election.
That approach may have overshot the mark this year. By weighting their samples to 2024 voting patterns, some pollsters may have assumed a more Republican electorate than the one that actually turned out.
(The Times/Siena Poll’s approach to incorporating the results of past elections is somewhat different than other public pollsters; read more here.)
New voters may have been an especially difficult group for pollsters to represent. Midterm elections tend to attract only the most regular voters, but Times Voter Trends estimates suggest that more than 10 percent of voters nationally didn’t vote in the last presidential election. Those voters backed Democrats by more than 30 points.
If a pollster missed the Democratic-friendly turnout and new voters, their results could be way off. An Emerson College poll in Texas, for example, underestimated Mr. Talarico’s win by 10 percentage points, and turnout was probably a factor. The poll found that voters who had backed Mr. Trump in 2024 outnumbered backers of Kamala Harris by 11 points; Times Voter Trends and exit poll data suggest that previous Trump voters outnumbered Harris voters by a much smaller margin, probably in the mid-single digits. The Emerson poll also found new voters making up just 3 percent of the electorate, compared to 15 percent of actual voters, according to Times Voter Trends.
Maine offers another potential instance of this, with polling from Marist finding Troy Jackson, the Democrat, ahead by nine percentage points among registered voters. The same poll, when accounting for the likeliest voters, had Mr. Jackson up by only two points. He won the state by six. With a different model of the electorate, Marist might have had a more accurate result.
Democrats’ strength grew over time.
Another possible source of error this year is that voters shifted over time, with Democrats seeming to gain strength, sometimes after surveys were no longer in the field.
Kansas provides a good example. A Times/Siena poll taken in September found the Senate race to be even. By October, another had Adam Hamilton ahead by five percentage points. In the end, he won the race by exactly that margin. Most other polls in the state followed a similar path.
This was the case across the Times/Siena polls this year when taken as a group.
Nationally, this was clear as well. A September Times/Siena poll had Democrats with a nine-percentage-point advantage in the race for the House, with that gap growing to 11 points by October. The final Times/Siena national poll was taken in mid-October, but other national polls showed Democrats’ strength continuing to grow in surveys taken in the final week before the election.
If other pollsters had been in the field closer to the election, it’s possible they would have gotten closer to the final result.